
Know how many people come, and when.
Footfall Analytics counts visits to your location live and continuously, and turns the counts into reporting by day and hour, so every decision about the location rests on evidence.
Weekly footfall report
Sample data- Visits
- 45,580
- Against last week
- +5%
- Busiest
- Saturday, 13:00
| Counting point | This week | Change |
|---|---|---|
| Z1 Main street | 18,420 | +8% |
| Z2 Square | 11,280 | +6% |
| Z3 East entrance | 9,150 | −6% |
| Z4 Car park link | 6,730 | +10% |
By hour Busiest 13:00
By day Sat 9,050
What your footfall data answers.
Footfall analytics tells you how many people come to your location, when they come and where they go, and shows what changed after every decision you make.
-
How many people come
Counts at every counting point, every day, so you know the real size of your audience rather than an estimate.
On the report: Counting point table -
When they come
The busiest hours and days, so staffing, opening hours, deliveries and events are planned around real demand.
On the report: By hour and by day -
Where they go, and how long they stay
Compare counting points to see which entrances, frontages or zones carry the most people, and how long visitors stay in each.
On the report: Key plan -
What changed
Compare any day or period with a typical one to see the effect of an event, a campaign, works or a new tenant.
On the report: Change column -
Evidence you can share
Independent figures for boards, tenants, investors, funders and partners, in reports they can read.
On the report: The whole report
What's included.
Live counting at your location, a dashboard and reports your team can use, your data in your own systems, and counts rather than information about individuals.
-
Counting at your location
On the report: Z1 to Z4 on the key planSensors at agreed counting points pick up the WiFi signals phones send out (probe requests) and count visits continuously, every day, with no manual surveys to organise.
-
A live dashboard and reports
On the report: By hour and by dayLive counts and dwell time for each counting point, with trends by day and hour. Run a report on demand, or have reports sent automatically by email.
-
Your data, your systems
On the report: The whole reportExport the data whenever you need it, or connect it to your own systems through our API.
-
Counts, not people
On the report: Counts only, no namesYou see how many people came, when and for how long, not who they are. Phone identifiers are hashed to comply with GDPR, and we take your data protection team through how the data is handled.
Who uses Footfall Analytics
Any organisation that needs to know how many people come to its location, and when. Pick your industry to see how it applies.
-
Retail
Plan staffing and opening hours around when shoppers actually come, and compare stores. -
Shopping Centres
Show tenants and investors how busy each entrance and zone is, week by week. -
Property Management
Back lettings, rent reviews and valuations with footfall at each asset. -
Outdoor Advertising
Support site pricing with measured impressions at each panel. -
Events and Festivals
Know how many people came, by gate and hour, and plan the next event on it. -
Venues and Attractions
See which areas visitors actually spend their time in, with dwell time by area. -
Local Authorities
See what the town centre needs and prove what investment achieved. -
BIDs and Town Teams
Show levy payers what the BID delivers, with independent numbers.
From sensor to report.
Sensors on site count the people who pass, and every count feeds the portal. It has dozens of reports, and these are two of them. The dashboard shows your location's last seven days at a glance. The national benchmark compares it with similar locations across the country over the same period.
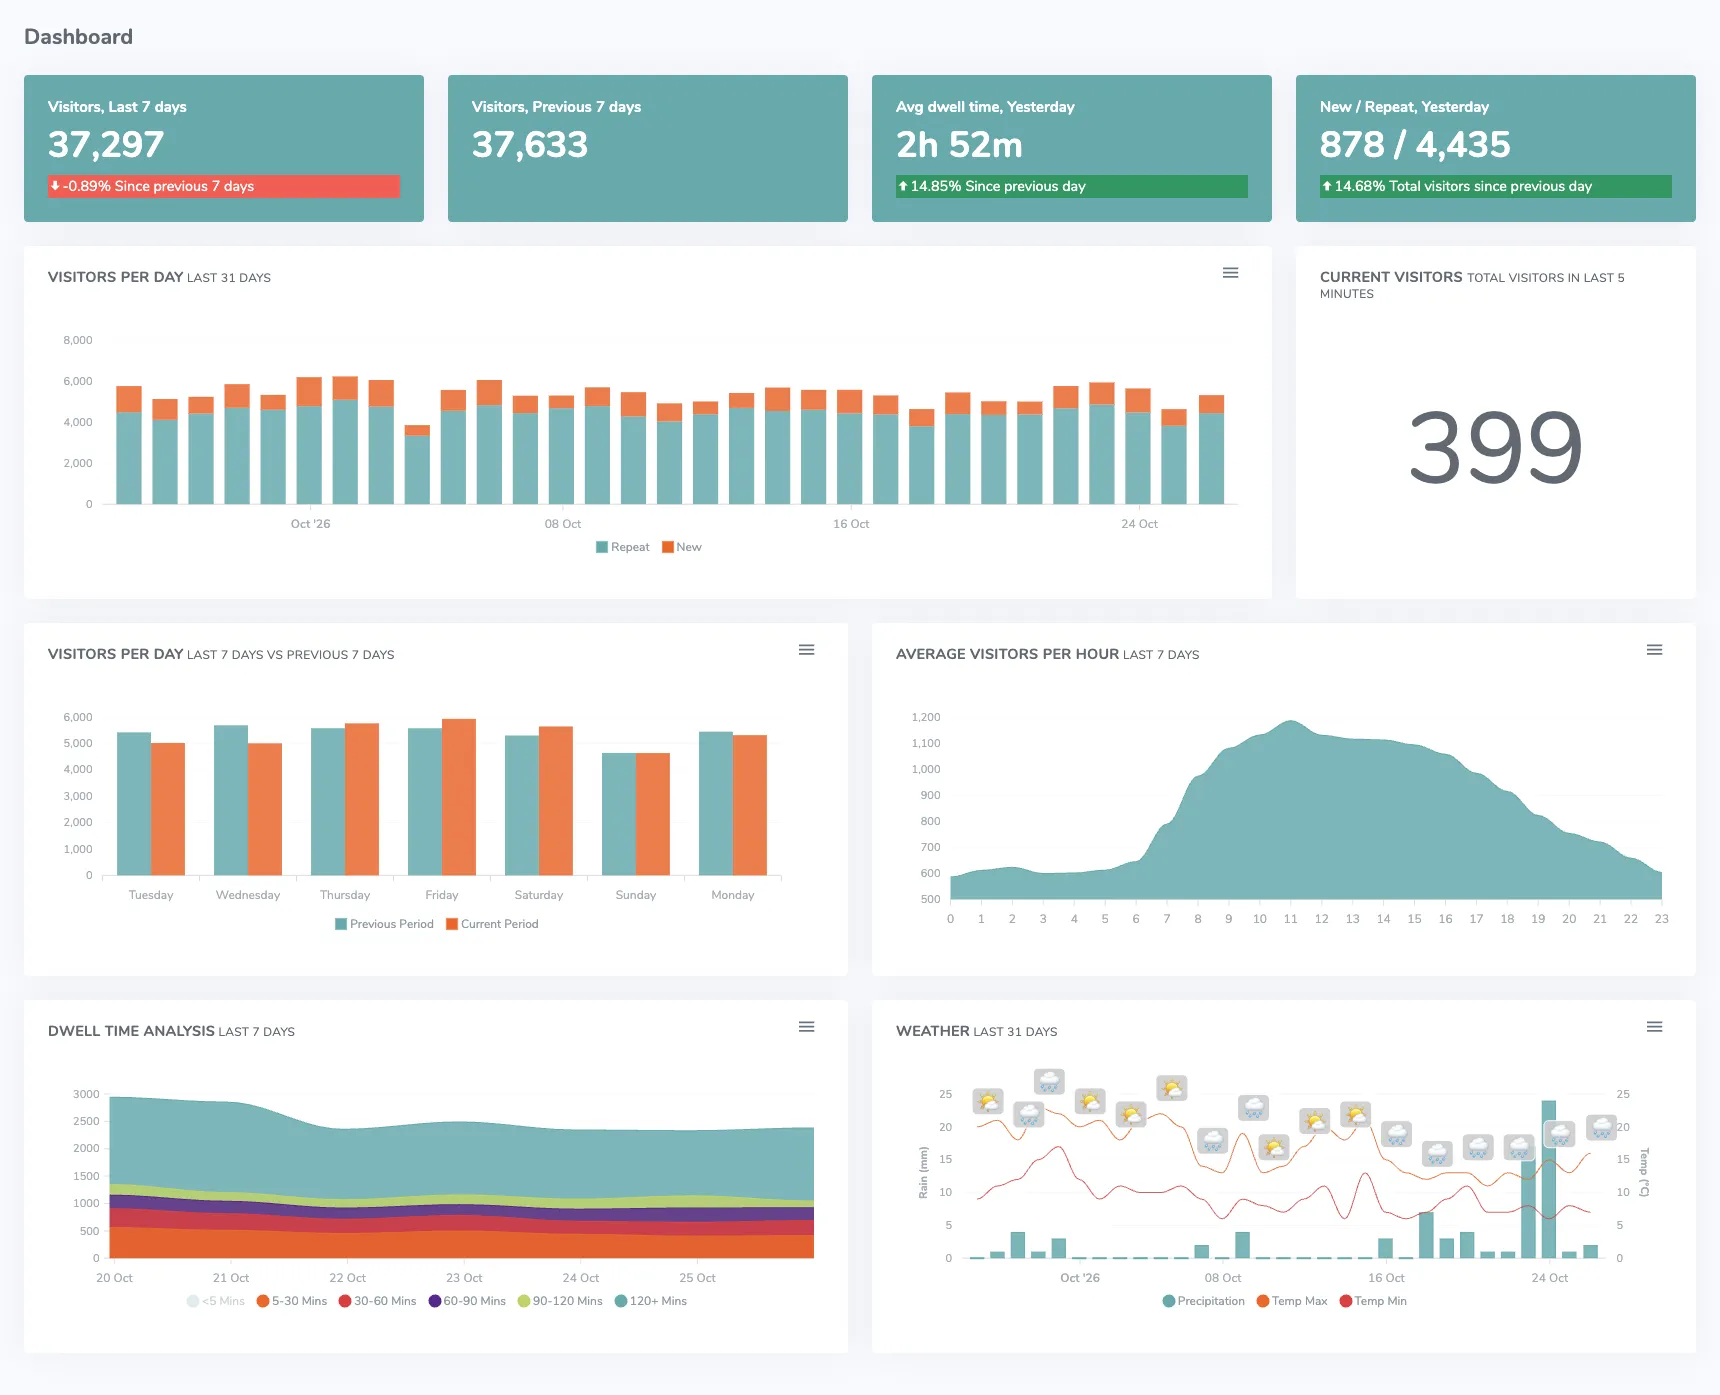
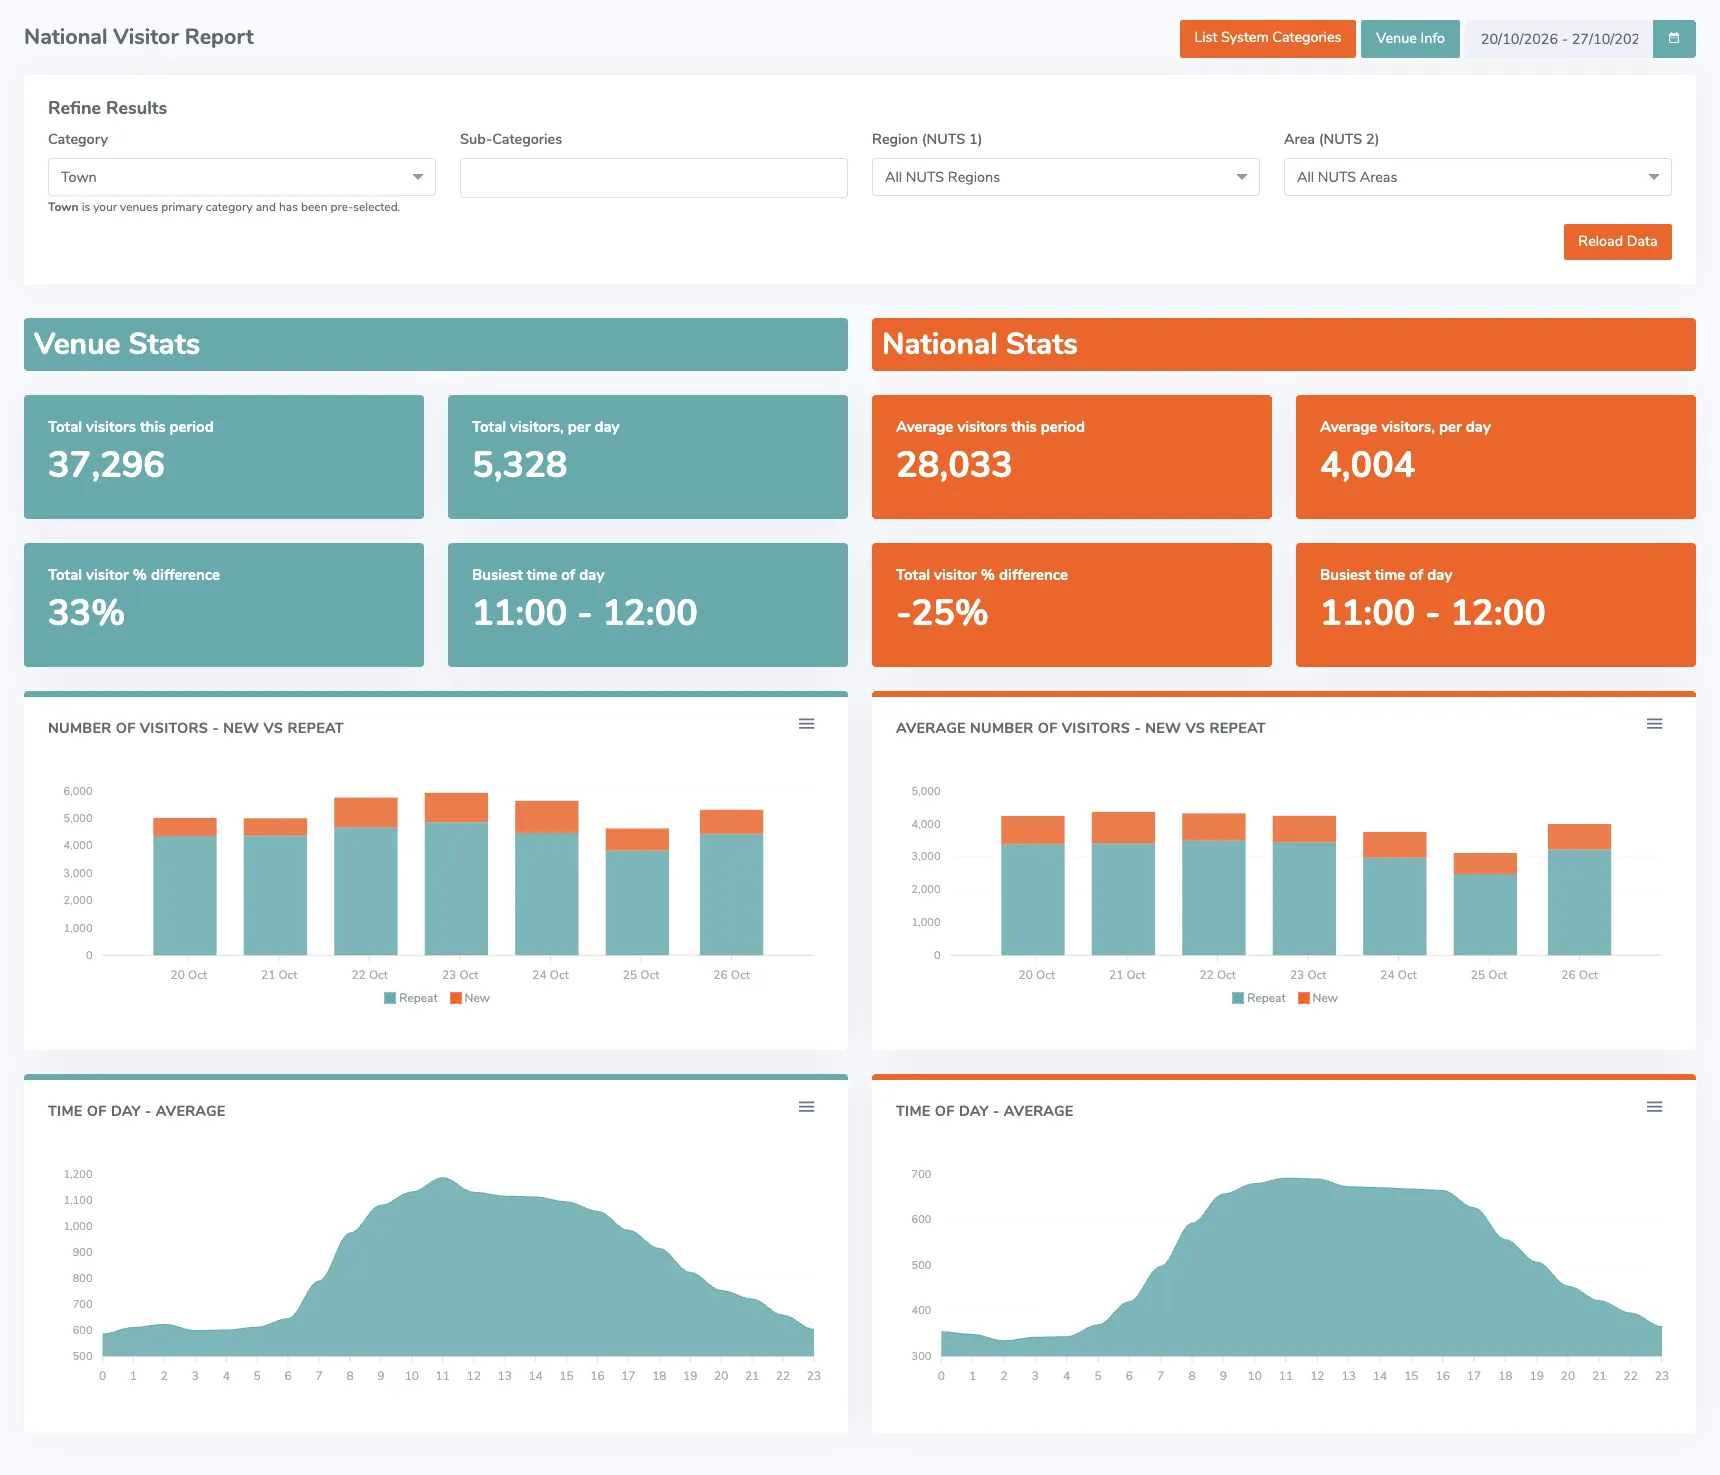
See the reporting in action
A short walkthrough of the dashboard and reports you work with once your location is counted.
Walkthrough video coming soon
Questions buyers ask
Footfall analytics is the counting of people at a location, turned into reporting by day and hour that shows how many come, when, and what changed.
What is footfall analytics?
Counting how many people visit a location, at agreed counting points, by day and hour, and turning those counts into reporting you can act on.
What kinds of location can you count?
Stores, shopping centres, town and city centres, event sites, venues and attractions, and advertising sites. If people pass through it, it can be counted.
How is footfall counted?
Sensors at agreed counting points pick up the WiFi signals that phones send out as they look for a network, known as probe requests, and count visits from them continuously. The counts feed a live dashboard and reports, so there is no manual survey to organise.
Can you measure how long people stay?
Yes. When the same phone's hashed identifier is picked up again over time, or by another sensor, it shows how long visitors stay in each counted area and the routes they take. It works at any type of location, so you can see which areas hold people and which they pass straight through.
Can we see footfall live?
Yes. The dashboard shows live counts for each counting point, alongside the history by day and hour.
Does footfall counting identify individuals?
No. Each phone's identifier is hashed, replacing it with a scrambled code, as part of how we comply with GDPR, and footfall reporting gives you counts and trends, not information about who people are. We will take your data protection team through how the data is collected and handled as part of setting up.
How do we get our reports?
Run a report for any period on demand, or have reports sent automatically by email to the people who need them. Both show counts at each counting point by day and hour, with trends over time.
Can we compare before and after a change?
Yes. Compare any day or period with a typical one at the same counting points to see the effect of an event, a campaign, building works or a new tenant.
Can we export the data or use it in our own systems?
Yes. Export the data whenever you need it, or connect it to your own systems and dashboards through our API.
Can you combine footfall with our other data?
Yes, as an optional extra. Sales figures and other data sets can be brought into our system and reported alongside footfall.
Can we share the data with partners?
Yes. Reports can go to boards, tenants, investors, funders and partners, so everyone works from the same independent numbers.
How do we get started?
Book a demo. We will talk through your location and what you need to know, and show you what the reporting looks like.